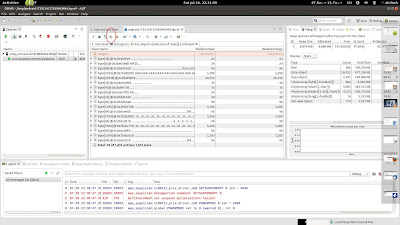
Analyse Android memory leak using eclipse MAT tool
Links:
--------
Mat tool download:
http://www.eclipse.org/mat/
Android SDK download (it includes eclipse for Android):
http://developer.android.com/sdk/index.html
package com.example.memoryleaktest;
import android.os.Bundle;
import android.app.Activity;
public class MainActivity extends Activity {
static Leaky leak = null;
class Leaky {
}
@Override
public void onCreate(Bundle savedInstanceState) {
super.onCreate(savedInstanceState);
if (leak == null) {
leak = new Leaky();
}
}
}
In our case we have wrote below query
select * from com.example.memoryleaktest.MainActivity
Right click on the result showing and goto Path to GC Roots -> Exclude weak references
Shallow heap is the actual size of the object allocated and Retained Heap is the size caused by total references with that object
You can also try the same analysis by removing static keyword from the code which is a perfect non leak code
Before
static Leaky leak = null;
After:
Leaky leak = null;
In this case leak object wont be showing up in the analysis
Links:
--------
Mat tool download:
http://www.eclipse.org/mat/
Android SDK download (it includes eclipse for Android):
http://developer.android.com/sdk/index.html
1. Create Android project with below code in MainActivity
package com.example.memoryleaktest;
import android.os.Bundle;
import android.app.Activity;
public class MainActivity extends Activity {
static Leaky leak = null;
class Leaky {
}
@Override
public void onCreate(Bundle savedInstanceState) {
super.onCreate(savedInstanceState);
if (leak == null) {
leak = new Leaky();
}
}
}
 |
| 1. Code with leak |
2. Run app
Run App in debug mode and switch to DDMS view from right top of window.
If you could not find Devices page then you can get it from menu options Windows -> Show view -> Others -> Android
Click on Run Heap option
**Note: if you cant find any view then please goto Windows -> Show view -> Others -> Android and enable views you are looking for
 |
| Update Heap |
3. Run heap analyser
After clicking on Update Heap icon then click on Cause GC icon to get memory allocation result**Note: if you cant find any view then please goto Windows -> Show view -> Others -> Android and enable views you are looking for
 |
| Run GC |
4. Dump HPROF File
Dump HPROF File by clicking on highlighted icon and wait for few seconds to generate analysis page |
| Dump HPROF File |
5. Run Histogram
Clicking on the highlighted icon will generate Histogram view which contains number of objects created for that particular class.
Click on Shallow Heap title bar to make it order by higher objects on top
Right click on the byte[] -> Lists Objects -> with incoming references
 |
| Incoming Reference |
7. Query Class to find leaks in that particular class
We can write a simple sql like query to show leaks only related to a particular class.In our case we have wrote below query
select * from com.example.memoryleaktest.MainActivity
 |
| Object Query Language |
8. Path to GC Root
Click on exclamation (!) mark or F5 to run the queryRight click on the result showing and goto Path to GC Roots -> Exclude weak references
 |
| Path to GC root |
9. Find memory leak Object
Now you can find leak object is showing up in the page which is causing the memory leak.Shallow heap is the actual size of the object allocated and Retained Heap is the size caused by total references with that object
 |
| Find memory leak object |
You can also try the same analysis by removing static keyword from the code which is a perfect non leak code
Before
static Leaky leak = null;
After:
Leaky leak = null;
In this case leak object wont be showing up in the analysis
